Sunday, January 22, 2023


Trading with AlphaVL: The Newsletter for Growth and Momentum Investing

AlphaVL Trading: The Key to Profiting from S&P 500 Industrials.


In trading / investing it's not about how much you make, but how much you don't lose.” Bernard Baruch


The market direction for equities advanced Friday, with market participants taking note of a softer tone from members of the Federal Reserve's committee. This has raised expectations for a 0.25-point rate hike at their next meeting and another 0.25-point hike in March.

 According to the CME Group's Fed Watch, there is a 55% probability that US interest rates will pause in May, suggesting market participants are optimistic about economic growth momentum over this period. With upcoming big cap tech earnings reports being released next week, investors will be keeping an eagle eye on market fluctuations, looking to capitalize on any potential soft-landing scenarios resulting from the data.

 Friday’s close showed that growth - momentum had again changed direction as equity indexes rose. The bullish market breadth on both the NYSE and NASDAQ was encouraging, advancing issues beat declining issues at a ratio of almost 4:1 on the NYSE and 2.6:1 on the NASDAQ, with volume at 83% and 86%, respectively. This increase in positive activity pushed stocks up along with oil prices rising 1.07 to $81.40 per barrel, accompanied by gains in Gold for a change; this precious metal gained 5.50 and closed at $1929.40 an ounce. The VIX retreated 3.27% down to 19.85, closing strong, despite a turbulent few days in the markets prior to Friday's gains. All of the movements demonstrate that growth after weeks of a negative outlook may be poised to make a quick turnaround.

 Despite the holiday-shortened trading week with volatile market conditions, our bullish signal on January 12th remains intact. Evidence of this strong signal lies in both the wider market, where a positive direction is suggested by improving breadth, as well as in our smaller trading watch list that is detailed in the spreadsheet attached. Analysis over the weeks ending January 20th clearly indicate that profitability is achievable even in unpredictable markets.

As the quarterly earnings season progresses, investors have held on to positive reactions despite the potential for weaker growth in leading stocks. Goldman Sachs saw a decline following their Q4 earnings miss, but Morgan Stanley stood in stark contrast when their earnings miss was met with larger optimism as the Nasdaq Composite reclaimed all YTD losses by Friday's close. The Dow Jones Industrial Average and S&P 500 saw an upwards movement as well and managed to overcome a sizable portion of their weekly losses. This positive directional change had traders optimistic and bullish over positive growth potentials by market close on Friday.


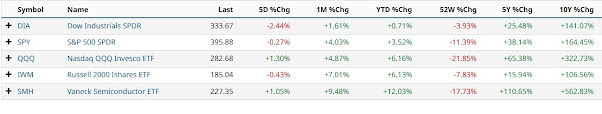
While there is no denying the fact that the market had a poor week ending the 20th, we must not lose focus on the Year to date (YTD) results through  January 20th. The Dow Jones Industrial Average is up 0.71%, the S&P 500 is up 3.52%, the NASDAQ 100 is up 6.16% and the Russell 2000 is up 6.13% and the SMH is up 12.03%.  Lest you are not familiar with the SMH, it is an ETF, the Vanek Vectors Semiconductor ETF, which  seeks to replicate as closely as possible, before fees and expenses, the price and yield performance of the MVIS US Listed Semiconductor 25 Index (MVSMHTR). 


I  entered this past week, you may recall that I had set up ten Bull Call Spreads for possible trades on Tuesday, believing that the upward trend would remain intact.  Tuesday’s action was such that I changed course for the week while only placing three trades, in LW, SPY, and ASML. The week ended up with two losing and one winning trade, however it was a profitable week with a 23.1% return on the premium spent. The SPY trade carried the week.

 The fourth quarter earnings season for the S&P 500 is off to a less than impressive start. Companies are reporting surprises mostly to the downside with the number and magnitude of positive surprises well below their 5-year and 10-year averages. Looking back, this marks the first year-over-year decline in earnings since Q3 2020. To date, the situation continues its downward trajectory as companies report negative surprises and analysts revise estimates further downwards. Thus, the overall trend in earnings decline for this quarter looks set to continue, while feeding the market volatility. 

 As such, I will set up possible trades in the DIA, IWM, QQQ and SPY on both sides of the screen Bull Calls and Bear Puts while waiting for the market to do what it will do best, day by day.  These trades may end up as Day Trades or Swing Trades, but I will not be holding anything for a long period over the next three or four weeks.

 To access the current copy of the data behind our trading please follow this link: Trading with AlphaVL

Good luck and Good Investing!


Monday, January 16, 2023


Trading with AlphaVL: The Newsletter for Growth and Momentum Investing


AlphaVL Trading: The Key to Profiting from S&P 500 Industrials.


Ride the wave of the S&P 500 industrial stocks, Caterpillar and Freeport-McMoRan are key players, 53% gain for Caterpillar stock since Q3 along with a 63% rally for Freeport-McMoRan shares since Q3.

Friday saw market breadth advance as the market responded well to December's inflation data weakening, with Initial Jobless Claims coming in below expectations. The Fed Watch Tool points to a 96% probability of a 0.25-point hike in the Fed Fund rate at the FOMC Meeting ending February 1. This has investors happy as growth and momentum stocks are coming back into play and falling rates have boosted market sentiment, allowing the market indexes to move forward despite an otherwise sluggish start; the 10-year Treasury fell back below 3.5% to close at 3.43%, while the two-year T-Bill rate dropped to 4.12%. Growing market confidence appears to be well placed for the time being, with market breadth advancing despite worries of a slowing economy.

As part of our master watch list we track the daily activity of five major indexes and fourteen ETF’s, primarily the eleven major sectors plus three specialty sectors.  The status of each is set forth under the tab labeled ‘Unsorted’ which is part of our Spreadsheet which is attached.  

Today we have added a separate tab labeled ‘Major Markets’, here you will find our current call, which is produced by our market model, on each of the five markets plus additional information covering the models  win/loss factor, average days held and most recent signal date by index. 

As of Thursday January 12th, our model had turned Bullish, refer to the ‘Summation’ tab for further detail on the model.  The Major Markets tab contains the data specific to each index along with a chart laying out the Buy/Sell calls and supporting indicators for each index. 

Included with this edition are ten trade ideas for your consideration.  Here also you will find the summary data for the models’ performance with each underlying along with the set up which we will be watching when the market opens Tuesday January 17, 2023.  Please refer to the Disclaimer included with the spreadsheet prior to trading.


In all cases where back tested data is referred to, the time period of the test is from January 2017 through December 2022.

 To access the current copy of the data behind our trading please follow this link: Trading with AlphaVL

Good luck and Good Investing!


Monday, January 9, 2023

Pay Attention to This Week's Inflation Reports


This week is the perfect time for anyone interested in economic numbers to pay attention. The Consumer Price Index (CPI) will be released on Wednesday and analysts expect it to show a 6.5% increase from the same period last year, which is slightly lower than November’s 7.1%. On Friday we’ll receive import and export prices as well as the University of Michigan sentiment numbers, which usually provide guidance on expectations for future spending habits. Investors and market watchers will be closely following these reports so they can determine if the economy is accelerating or decelerating in regard to inflation so they can make informed decisions.

The CPI report measures changes in consumer prices of goods and services such as housing, food, transportation, medical care, and more—essentially covering all areas that are important for consumer spending. Analysts predict that this month's CPI report will reveal a 6.5% increase from the same period last year, which is slightly lower than November's 7.1%. This could indicate a slowing of inflationary pressure but there are other factors at play here too, such as rising energy costs due to increased demand caused by cold winter weather across the northern US states. These factors need to be taken into consideration when analyzing the CPI report and forming conclusions about inflationary pressures in the economy. 

On Friday we'll also receive import and export prices figures which measure changes in prices paid by US customers for foreign-made products. This data provides insight into how much product costs are increasing over time and gives investors an idea of whether or not there may be opportunities for cheaper imports or higher priced exports down the road. It also gives an indication of how much demand there is for foreign-made goods within the US market, giving clues about consumer confidence levels in different parts of the country or world depending on where those goods originate from.

Finally we'll get our hands on the University of Michigan sentiment numbers which measure consumer attitudes towards current economic conditions as well as their expectations for future spending habits. Attitudes towards current conditions give us an idea about how confident people feel about their current financial situation while expectations tell us whether consumers think that things are going to improve or get worse economically in months ahead—both extremely valuable pieces of information when trying to form an opinion about potential inflationary pressures building up in an economy like ours right now! 

This week is going to be an important one when it comes to analyzing inflation trends around the world as well, so it pays off to pay attention!  Make sure you keep your eyes open this week for any potential news reports related to these three key indicators because they could have a huge impact on your portfolio!

Today I will be watching the market through 10:00 AM seeking indications of trend directions.  I have prepared seven (7) Spreads for possible trading on ORCL, WYNN, BA, DHI, HUM, ANET and ADM.  There are four Bull Call spreads and three Bear Put spreads in this group and the market will dictate which one will be entered, when and at what strikes. Should the market do what it has been doing lately, going sideways after the first half hour or hour the day may just pass without any trading at all.  Spreads in SPY, IWM and QQQ may be employed in the absence of more definitive setups.

 For those interested a full copy of our watch list and breakdown can be found at Trading with AlphaVL.


Good luck and Good Trading!

Sunday, January 8, 2023


Trading with AlphaVL: The Newsletter for Growth and Momentum Investing

 Your guide to successful investing get the AlphaVL edge in trading - Grow your portfolio with our top picks.

 My strategy call is that we are entering a period of Market Neutrality, if not remaining in a Bearish trend. While the S & P 500 closed up 1.45% for the past week, the gain actually materialized in Friday’s session and was driven by what the market interpreted as positive economic news on both wages and job creation.  Given time to more thoroughly digest this data over the weekend,  investors may very well wake up Monday realizing that truly not much has changed, so be careful with where you trade and how long you hold your positions.

The chart below is a trend chart with four simple moving averages and one Anchored VWAP displayed. The SMA’s cover periods of 20, 50, 100 and 200 days.  The Anchored VWAP begins 1/10/2022. What the chart tells us is that the Close on Friday was below all the simple moving averages and significantly below the VWAP.  It’s not a confirmed reversal, but a decent trading day albeit still away from a definitive turn upwards. 


Historically, the S & P 500 trades within a daily 1% trading range, either up or down.  Inversely stated that is interpreted as 74% of the trading days the S & P 500 will trade within a 1% trading range up or down, with roughly 26% of the trading days it is either over or under a 1% trading range.  Friday’s action, while over the 1% range, was at best just the start of a reversal and a long way from a trend.

This week we saw Breadth at the end of the trading day come in with a Positive bias three days and a Negative bias on Thursday.  Friday’s Breadth was positive with advancing issues beating declining issues by 7:1 on the NYSE and by over 2:1 on the NASDAQ. Advancing volume was 84% on the NYSE and 67% on the NASDAQ. VIX dropped by 1.33 points (-5.92%) and closed at 21.13. Crude oil prices were flat after gaining 0.05 points (+0.07%) and the February contract closed at $73.72 a barrel. Gold prices tacked on 30.30 points (+1.65%) and finished at $1870.90 an ounce.

As I stated in last week’s newsletter, I was apathetic going into the holiday shortened week and did not post trading ideas.  As Tuesday began to unfold, my Bearish stance returned and I put on five Bear Put Spreads with January 20th expirations in ADM, ANET, AXP, RCL and UNH.  In total, I spent approximately $2,400.00 in premium. All positions were closed Friday with a gain of about $1,200.00.

The coming week will be a repeat of last week. Again, I am not posting ideas today since the coming week is likely to be very volatile with an increase in the number of Corporate earnings releases, which will drive the markets through late February.  Monday will see me with an eye to my watch list looking for names with defined trends in place with ample time to put a trade on prior to the underlying earnings release date and confirming price action in place.


To access the current copy of the data behind our trading please follow this link: Tradingwith AlphaVL

Good luck and Good Investing!


Sunday, January 1, 2023


Trading with AlphaVL: The Newsletter for Growth and Momentum Investing

 Are you a Bull or Bear? Should you Hold ‘Em or Fold ‘Em? Get the latest investing advice from Trading with AlphaVL

 2022 truly was an unprecedented year for investors, with the S&P 500 reaching a record high on January 3rd. This event is made more remarkable as it also marked the first time since 1977 and the very first time ever that 2022’s highest peak was also its yearly crest for the index.

The year initially began on a good note for stocks, with the S&P 500 hitting its highest watermark for the year on day one – as stated previously, an unprecedented event. However, just months later, stock prices began to decline sharply, with particularly drastic drops in tech stocks and more speculative investments. Around the same time, crypto had also taken a hit as news of the Sam Bankman-Fried scandal spread throughout the market. It soon became clear that far from being a bright start to the year, 2022 was marking a long and difficult decline in stock prices.

Financial historians will note that the Federal Reserve began setting us up for a new cycle of higher interest rates. When rates go up, it usually isn’t great news for stocks and historically, this could have the potential to spark a lengthy period of stagnant growth - like we saw in 1966-1982. However, it is important to note that such an outcome should not be taken as certainty. On top of this, it is also worth noting that the Fed receives no shortage of criticism when they take a tough stance on raising rates - just ask former Fed Chair Paul Volcker who put inflation in its place in the 80s and dealt with no end to opposition. The upside? He is now seen as a highly respected figure of economic lore so perhaps there is light at the end of the tunnel.

Santa was a no-show last week as yields crept higher sending stocks lower additionally the major averages were hit with tax selling after coming back from the long holiday weekend.  For the period, the DJIA lost 56.68 points (-0.2%) and settled at 33147.25. The S&P 500 eased 5.32 points (-0.1%) and closed at 3839.50. The NASDAQ gave up 31.38 points (-0.3%) finishing at 10466.48, while the small cap Russell 2000 picked up 0.32 point (+0.0%) finishing at 1761.25.

On Friday the Breadth was mostly negative with declining issues beating advancing issues by 314 units on the NYSE and 84 units on the NASDAQ. Declining volume was 56% on the NYSE, but advancing volume was 58% of the NASDAQ. The VIX rose 0.23 (+1.07%) and closed at 21.67. Crude oil prices jumped 1.95 (+2.53%) and the February contract closed at $80.38 a barrel. Gold prices rose 3.40 (+0.19%) and finished at $1829.40 an ounce.

The most current release of the CME Fed Watch shows the range for Federal Target Rate to be 425 – 450 BPS with 67.7% of the participants surveyed thinking in terms of a 25BPS rate increase at the February FOMC meeting and 32.3% in the 50BPS camp.  Personally, my feeling is that the earning releases of late January and early February 2023 will shift this range higher.

My target range for the S&P 500 for 2023 is 3500/4500.  Most likely the year will begin with a continuation of the current trend down until mid-year followed by a flat summer session with recovery beginning post Labor Day and running through year end. 

My current work leaves me stuck in the middle between a Bullish and Bearish stand for the open on Tuesday and truthfully, I am not very comfortable admitting that a Neutral Call (Sideways) is where I will open the New Year on January 3rd.  Like most of you I want to have my ten to fifteen working ideas set to go when the bell rings and then jump on the Trend and trade the days away.  

The universe which I follow starts with 549 names that are then reduced to an acceptable list of 312 qualified names based on fundamentals and technical indicators. The next step in the process is searching for names that are approaching new highs or new lows with acceptable levels of Open Interest and volume.  Friday’s spreadsheet was reduced to 15 Buy Side names along with 28 Sell Side and 29 Neutral names identified. 

What to do now: Review your work for the past year, learn from both your successes and your failurees, grow from your work.  Set higher standards for your performance in 2023,  review your work frequently and hold yourself accountable.  Make a commitment to excellence and then move towards those goals one day at a time.

To access the current copy of the data behind our trading please follow this link: Trading with AlphaVL

Good luck and Good Investing!